Evergreen Private Credit

Evergreen Private Credit
iDirect Private Credit Fund (“iDPC”) is a daily NAV interval fund with ticker-based trading offering advisors low-cost1, pure play exposure to middle market2 corporate lending alongside three leading private credit managers.
Pure Play
- 95%+ senior secured loans
- 100% sponsor-backed companies
- 100% middle market focus
- 100% floating rate loans
Easy-to-Use Structure
- Available through ticker DPCIX 3
- Evergreen fund without capital calls
- Quarterly liquidity, daily NAV
- 1099 tax reporting
- Sub QP/AI – no accreditation standards
Low Cost
- Efficient cost structure
- No incentive fee
- Low minimum investment
There can be no assurance that the iDirect Private Credit Fund will be able to implement its investment strategy or achieve its investment objectives.
Access to private credit managers
Sponsor-Backed Companies
Decades of disciplined investing
Over 75 years of disciplined buying throughout all cycles across PE and PC providing differentiated insight.
Scale
Large investment teams4
Approximately $50B total AUM across the representative private credit strategies.
135+ PC investment professionals on the ground globally.
Strong Historical Performance
Low loss ratios5,6
Audax Private Debt: 0.04%
Bain Capital Direct Lending: 0.21%
Charlesbank Credit: 0.02%6
*Source: Bain Capital as of June 30, 2025. Audax and Charlesbank as of June 2025.
The Private Credit Opportunity
Seeking attractive risk-adjusted returns for private credit
Historical Returns and Volatility by Asset Class
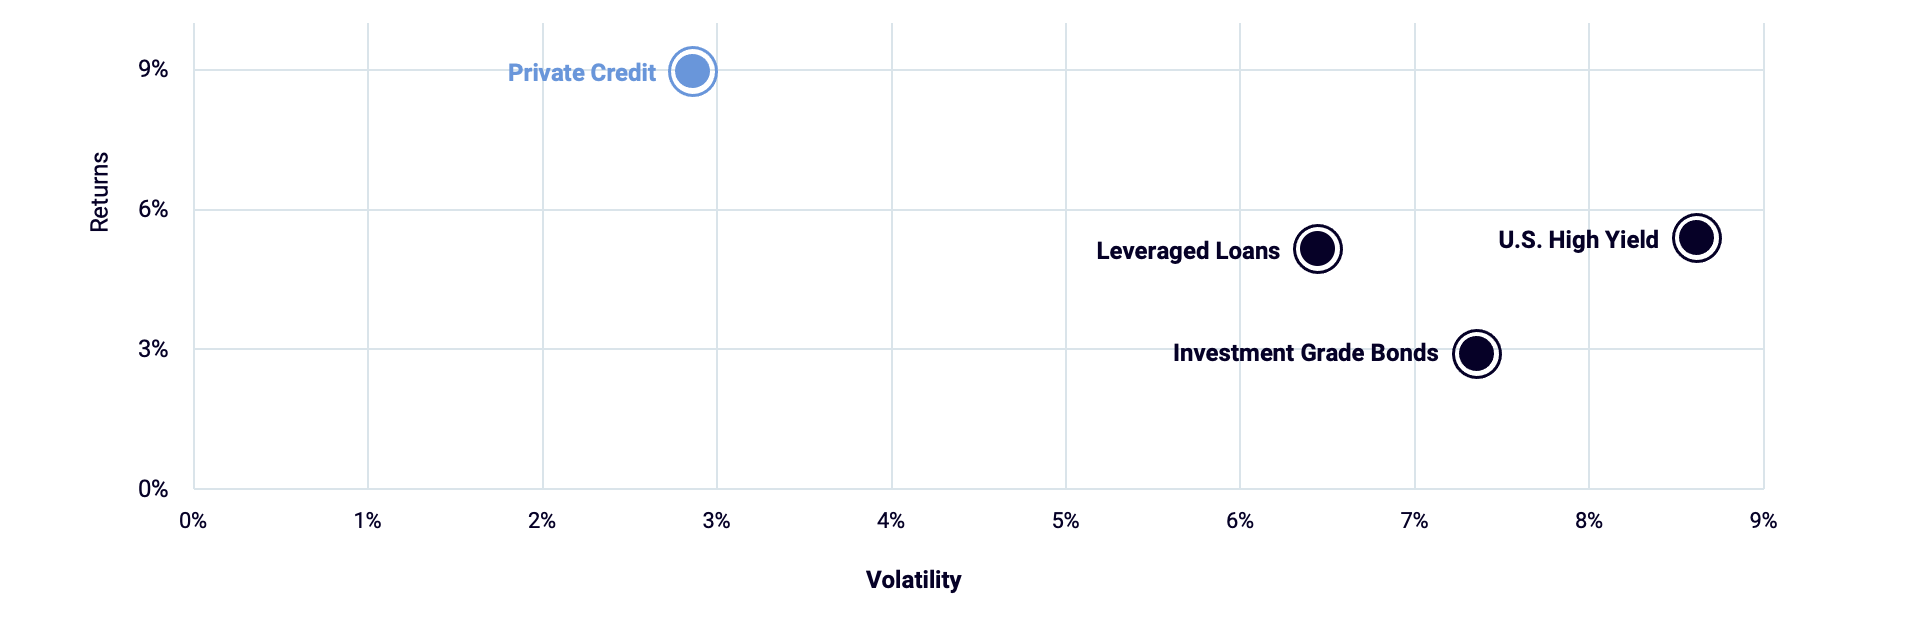
Source: Bloomberg. Data as of September 30, 2015 – June 30, 2025. Private Credit is represented by the Cliffwater Direct Lending Index. An asset-weighted index of over 11,000 directly originated middle market loans totaling $264B. Seeks to measure the unlevered, gross of fee performance of U.S. middle market corporate loans, as represented by the asset-weighted. performance of the underlying assets of Business Development Companies (BDCs), including both exchange-traded and unlisted BDCs, subject to certain eligibility requirements. Leveraged Loans is represented by the Morningstar LSTA US Leveraged Loan Index which is designed to deliver comprehensive, precise coverage of the US leveraged loan market. Underpinned by PitchBook and LCD data, the index serves as the market standard for the US leveraged loan asset class and tracks the performance of more than 1,400 USD denominated loans. High Yield is represented by the Bloomberg US Corporate High Yield Index which measures the USD-denominated, high yield, fixed-rate corporate bond market. Securities are classified as high yield if the middle rating of Moody’s, Fitch and S&P is Ba1/BB+/BB+ or below. Bonds from issuers with an emerging markets country of risk, based on Bloomberg EM country definition, are excluded. Investment Grade is represented by the Bloomberg US Corporate Bond Index which measures the investment grade, fixed-rate, taxable corporate bond market. It includes USD-denomination securities publicly issued by US and non-US industrial, utility and financial issuers. The index includes securities with remaining maturity of at least one year. For illustrative purposes only. This is not intended to be an offer or solicitation to employ a specific investment strategy. Past performance is not indicative of future results. Future results are not guaranteed. Non-traded investments are not valued as frequently as traded markets, which impacts volatility measures. Additionally, there are significant liquidity differences between public and private equities, as public equities can provide liquidity and greater access to company information and private equities have a longer time horizon and are considered illiquid.
Consistent yield premium in direct lending
Direct lending has consistently offered higher yields than corporate bonds, including in today’s market.
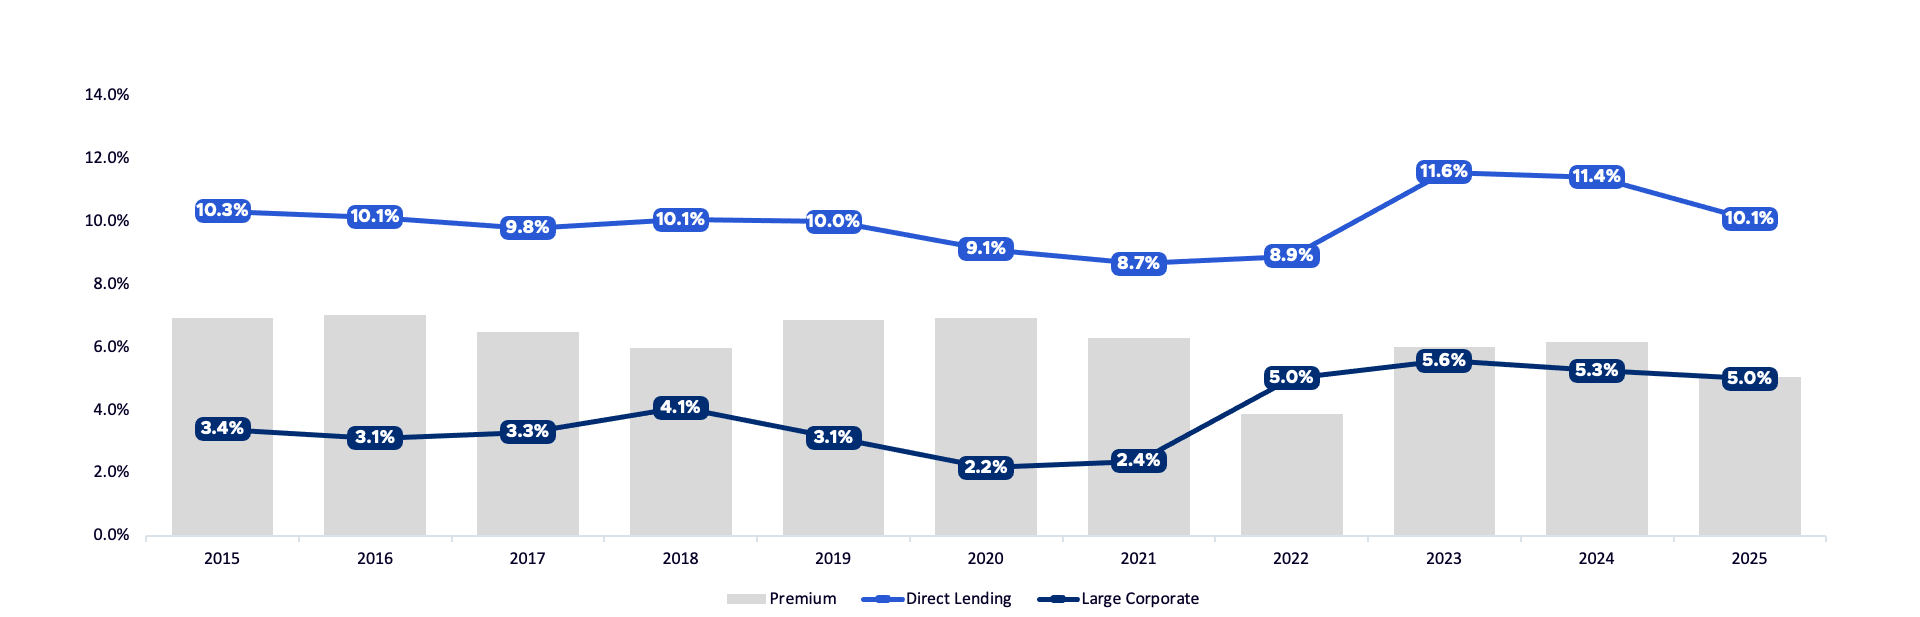
Source: Cliffwater, Ice Data Indices, LLC via FRED. As of December 31, 2025. Direct lending proxied by the Cliffwater Direct Lending Index, Large Corporate proxied by ICE BofA US Corporate Index Effective Yield. Premium represents the difference between the Cliffwater Direct Lending Index (CDLI) current yield and the ICE BofA US Corporate Index effective yield. For illustrative purposes only. Past performance is not indicative of future results. Future results are not guaranteed. Non-traded investments are not valued as frequently as traded markets, which impacts volatility measures. Additionally, there are significant liquidity differences between public and private equities, as public equities can provide liquidity and greater access to company information and private equities have a longer time horizon and are considered illiquid.
Resilient recovery rates in the core middle market7
iDPC focuses on core middle market loans, where recovery rates have historically been higher due to financial covenants and lender friendly structures.
Loan Recovery Rate (%)
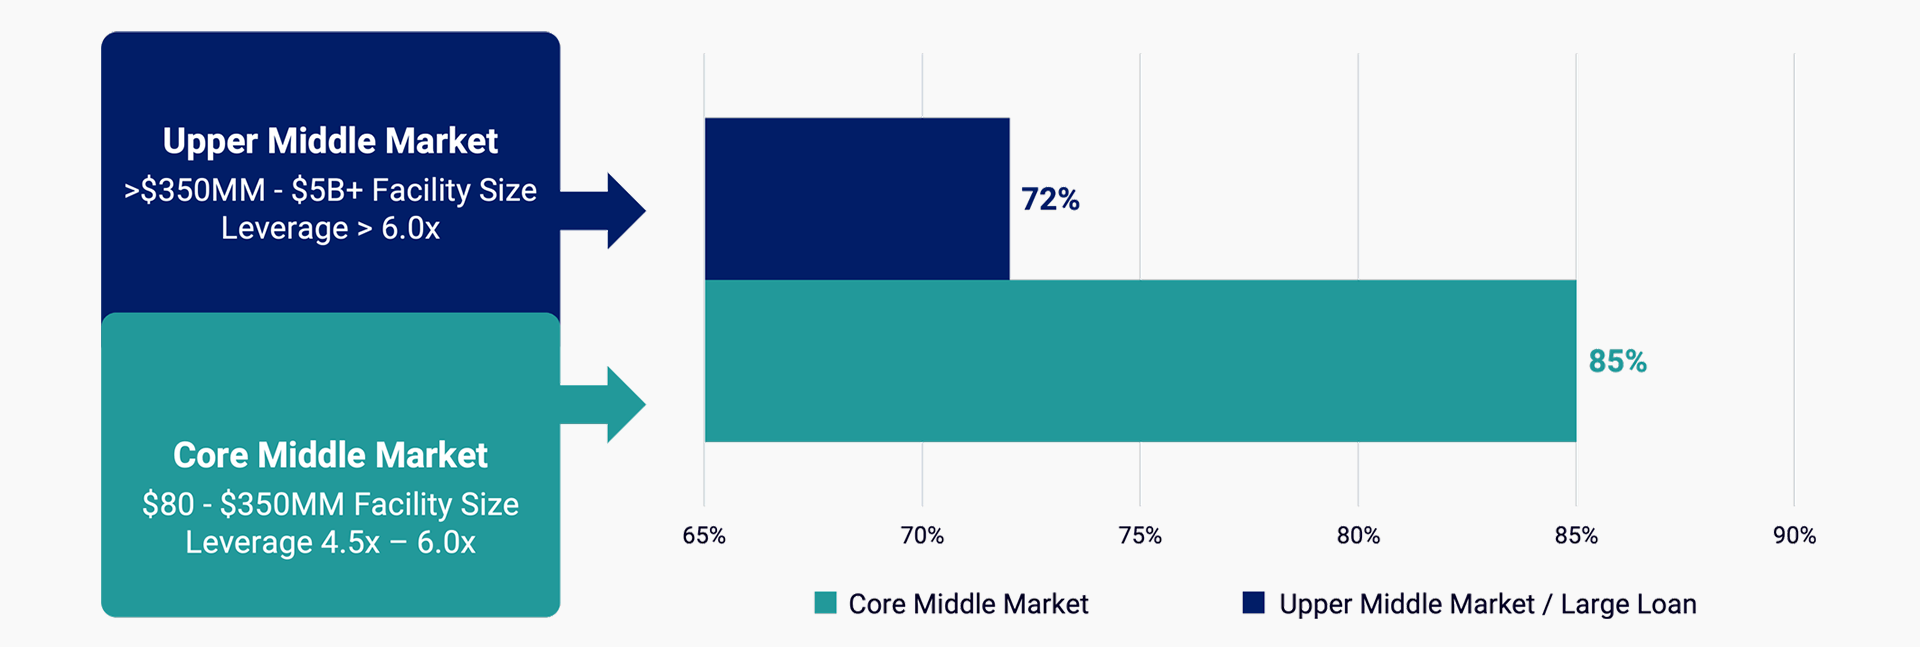
Source: Bloomberg, iCapital Investment Strategy, S&P Global Ratings, S&P Global Market Intelligence’s Credit Pro & Ratings Research. For illustrative purposes only. This is not intended to be an offer or solicitation to employ a specific investment strategy. Past performance is not indicative of future results. Future results are not guaranteed. Please see Important Information for index definitions.
The information shown, including any financial market performance, is based on current market conditions, which will fluctuate and may be superseded by subsequent market events or for other reasons. There is no guarantee that the market opportunity discussed will sustain for the life of the Fund.
Learn More and Watch the Latest iDPC Quarterly Update Here
iDirect Private Credit Fund
Q4 2025 Update
Hosted by: Sam Williams, iDPC Co-Portfolio Manager
Special Guest: Matthew Jacobson, Managing Director, Credit at Charlesbank
Webinar Topics:
- Current Private Credit Landscape
- Is Middle Market Credit Showing Early Signs of Stress?
- iDPC Portfolio & Fund Update
Learn More
Fund Management
Terms & Materials
NAV & Performance
1. Source: iCapital. Based on a comparison of fees and expenses from the relevant prospectuses as of July 7, 2025 for 10 peer private credit interval funds with at lease one year of operations.
2. The middle market is defined as companies acquired through buyout transactions between 25 million and 1 billion USD, as defined by PitchBook. Minority deals are not included. iCapital further defines the middle market per the loan tranche size: Core Middle Market 80-350 million USD and Upper Middle Market: 350 million to 5 billion USD.
3. Refer to iDirect Private Credit Fund prospectus for more information.
4. For discussion purposes only. The information contained herein is preliminary, is only a summary of key information, is not complete, and does not contain certain material information about the Fund, including important disclosures and risk factors associated with an investment in the Fund, and is subject to change without notice. As of June 30, 2025.
5. Loss ratio figures are annualized. Loss ratio represents the total impact to IRR of default losses on the investment population, net of recoveries. Based on strong quartile performance over the last five years. Source: Preqin data reflecting quartile performance for each manager from 2019-2024. This is the most recent information available as of June 30, 2025.
6. Represents the ratio of invested capital realized below cost since inception of the Credit Opportunities strategy on June 1, 2017.
7. This is not intended to be an offer or solicitation to employ a specific investment strategy. Past performance is not indicative of future results. Future results are not guaranteed. Please see important information for index definitions.
The information shown, including any financial market performance, is based on current market conditions, which will fluctuate and may be superseded by subsequent market events or for other reasons. There is no guarantee that the market opportunity discussed will sustain for the life of the Fund.
Index Definitions
Cliffwater Direct Lending Index is an asset-weighted index of over 11,000 directly originated middle market loans totaling $264B. Seeks to measure the unlevered, gross of fee performance of U.S. middle market corporate loans, as represented by the asset-weighted. performance of the underlying assets of Business Development Companies (BDCs), including both exchange-traded and unlisted BDCs, subject to certain eligibility requirements.
Morningstar LSTA US Leveraged Loan Index is designed to deliver comprehensive, precise coverage of the US leveraged loan market. Underpinned by PitchBook and LCD data, the index serves as the market standard for the US leveraged loan asset class and tracks the performance of more than 1,400 USD denominated loans.
Bloomberg US Corporate High Yield Index measures the USD-denominated, high yield, fixed-rate corporate bond market. Securities are classified as high yield if the middle rating of Moody’s, Fitch and S&P is Ba1/BB+/BB+ or below. Bonds from issuers with an emerging markets country of risk, based on Bloomberg EM country definition, are excluded.
Bloomberg US Corporate Bond Index measures the investment grade, fixed-rate, taxable corporate bond market. It includes USD-denomination securities publicly issued by US and non-US industrial, utility and financial issuers. The index includes securities with remaining maturity of at least one year.